Data Visualization • Code
This section highlights a 10 week experiment with generative art. Using a programming library called Processing, computer code is used to generate unique forms and color combinations that can never be replicated twice.
Audience & Context
The audience for this experiment was primarily myself. The goal was to learn a new programming skill and blend art with code, two of my favorite things in the world.
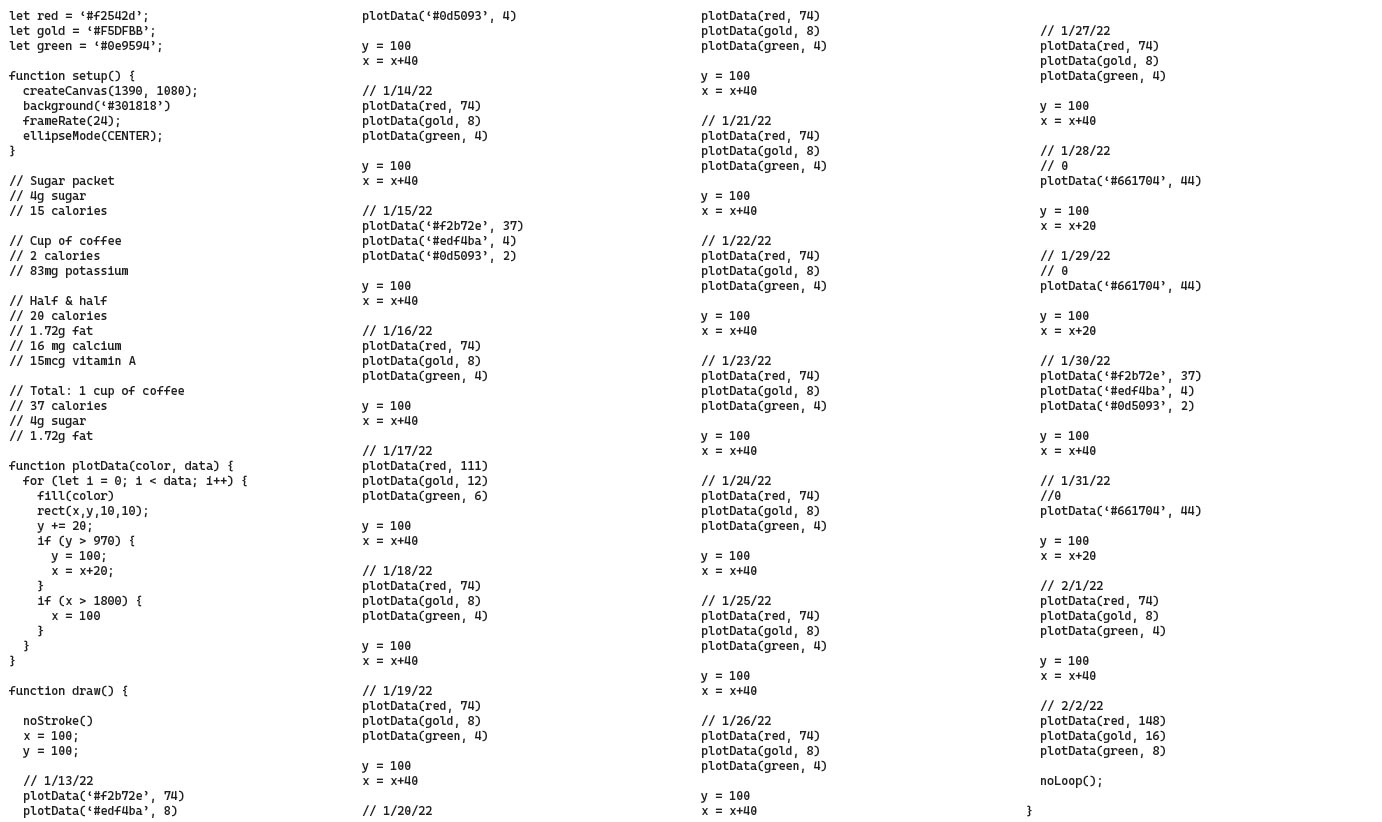
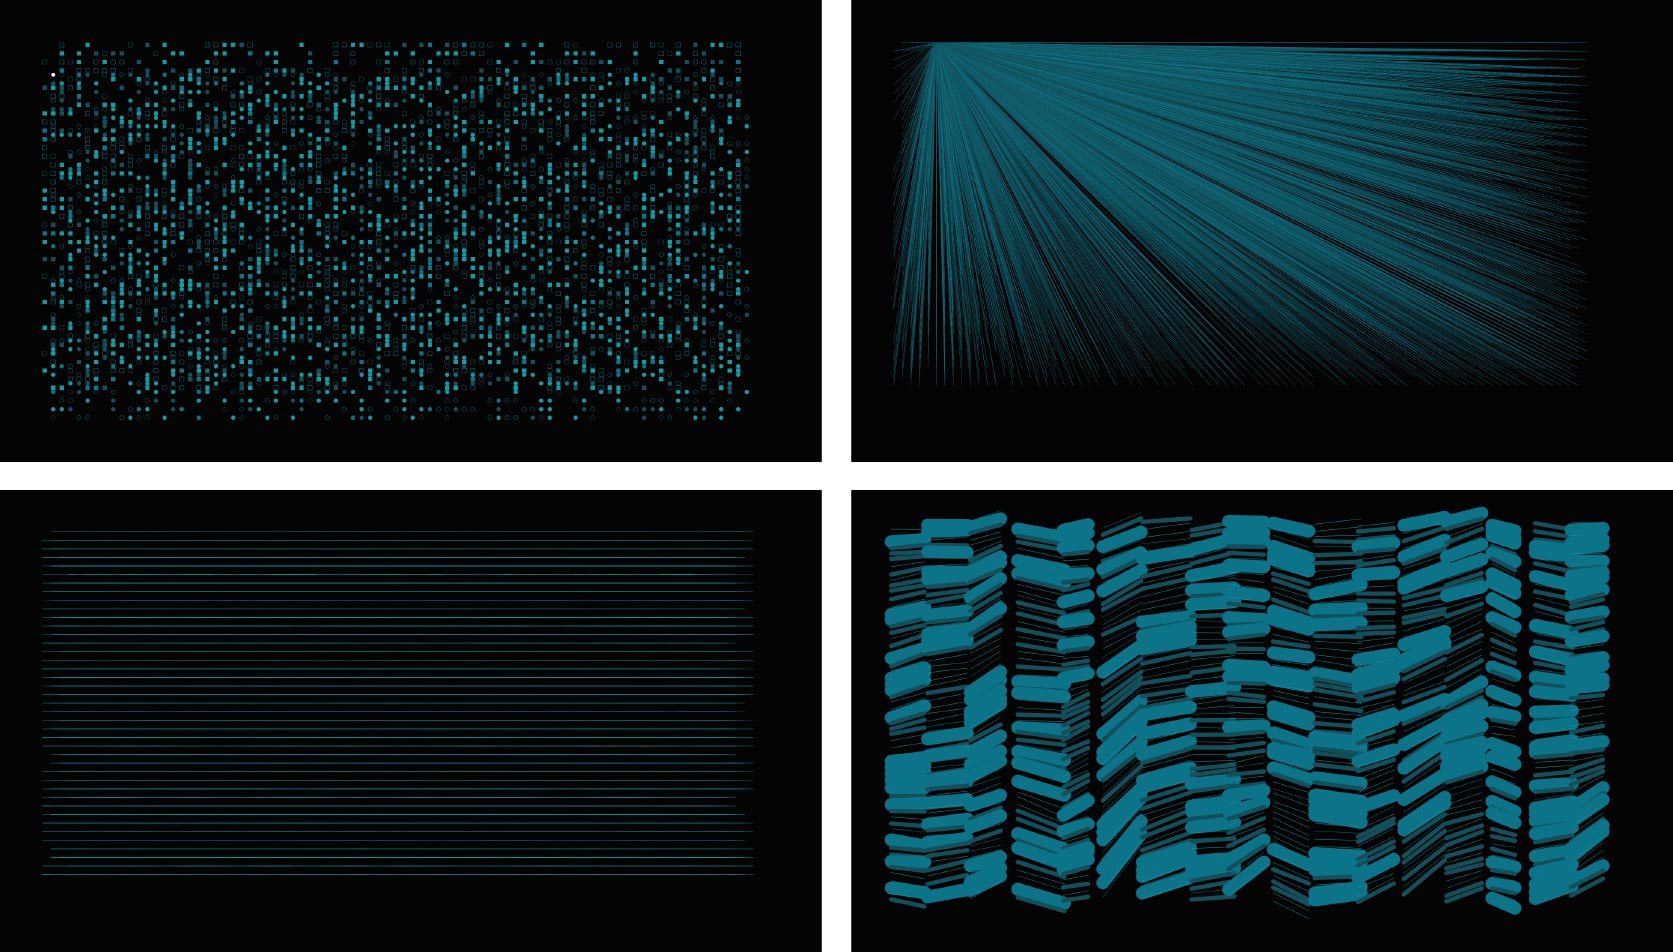
A sample of P5.js JavaScript code that produces generative or computational art.
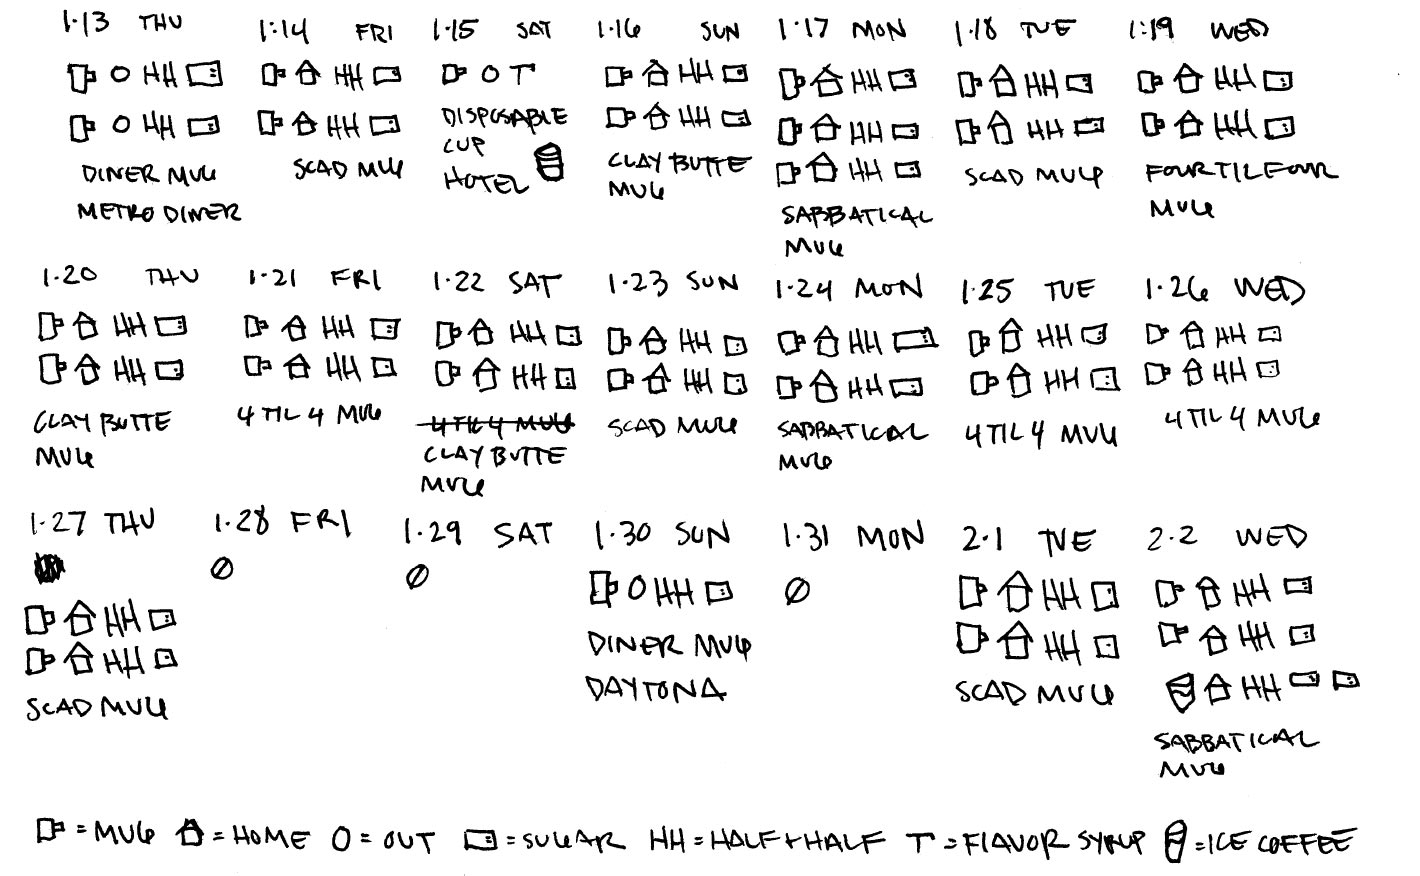
For several weeks I logged my coffee consumption in an analog visual notation that keeps track of number of cups, amount of cream & sugar, and which mug was used.
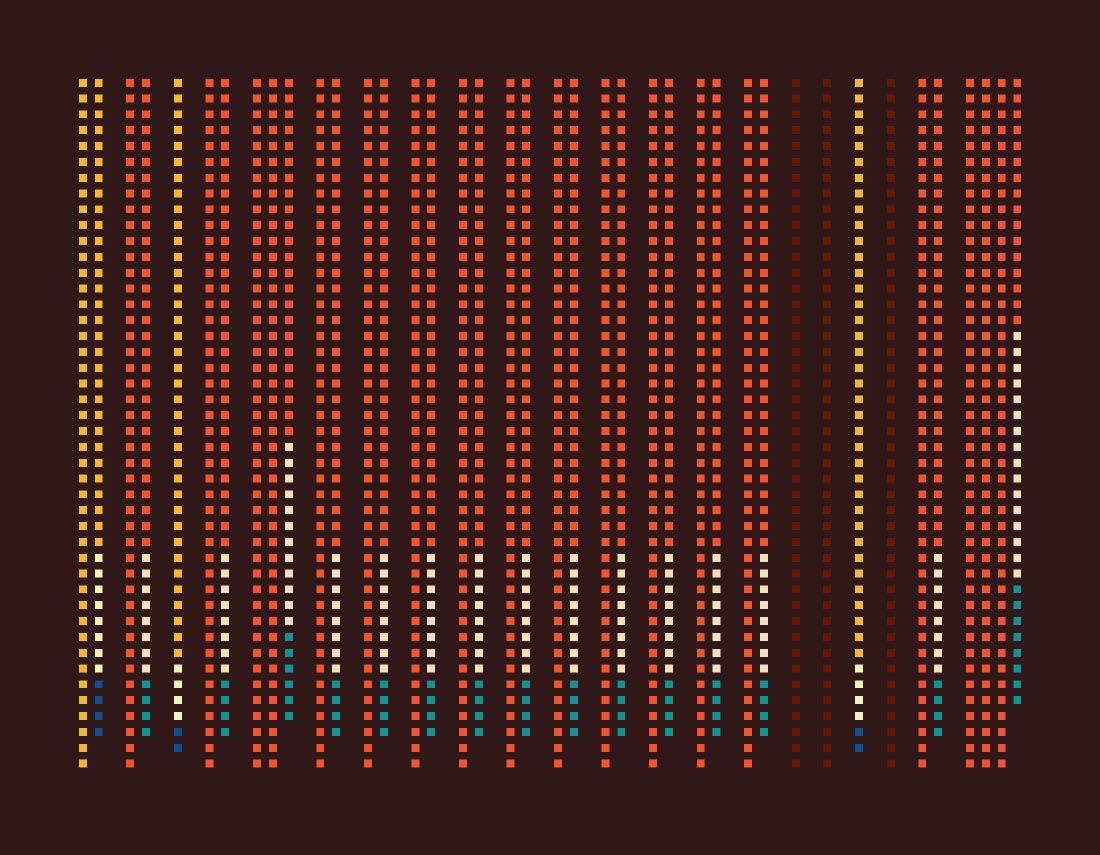
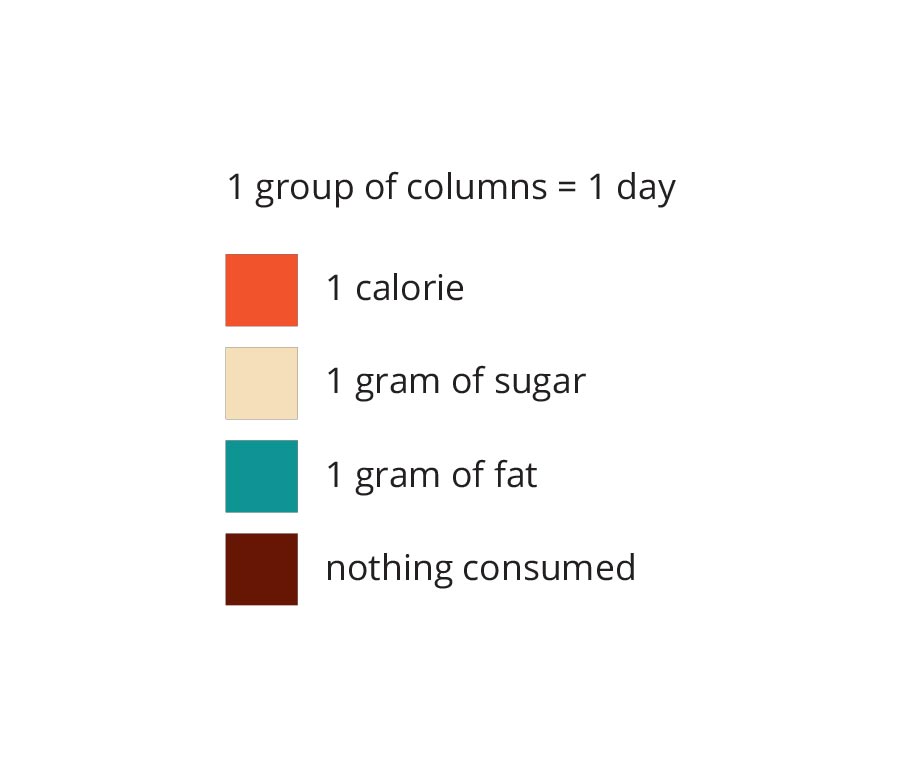
The final result was a rigid display of data visualizing my consumption habits over time.
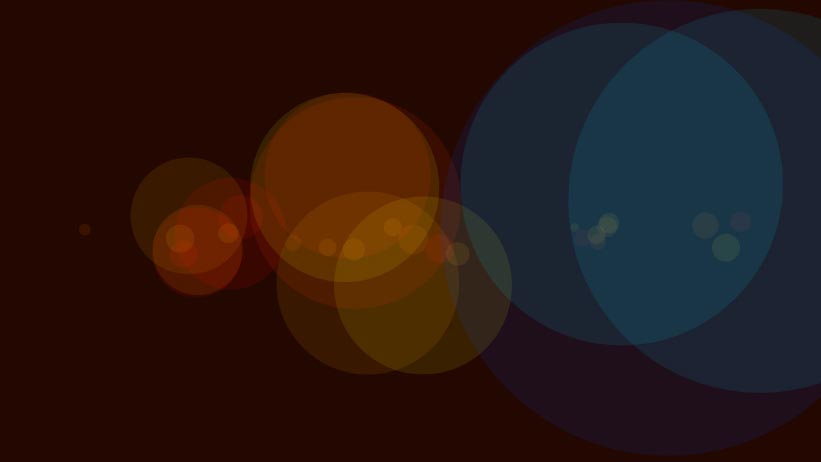
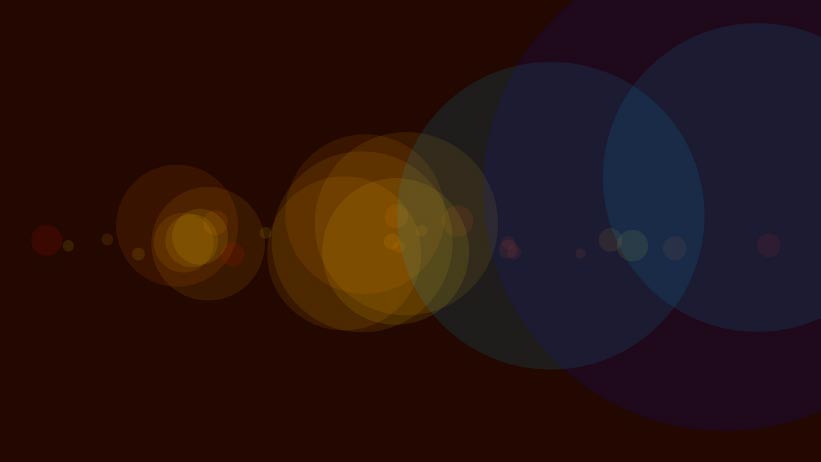
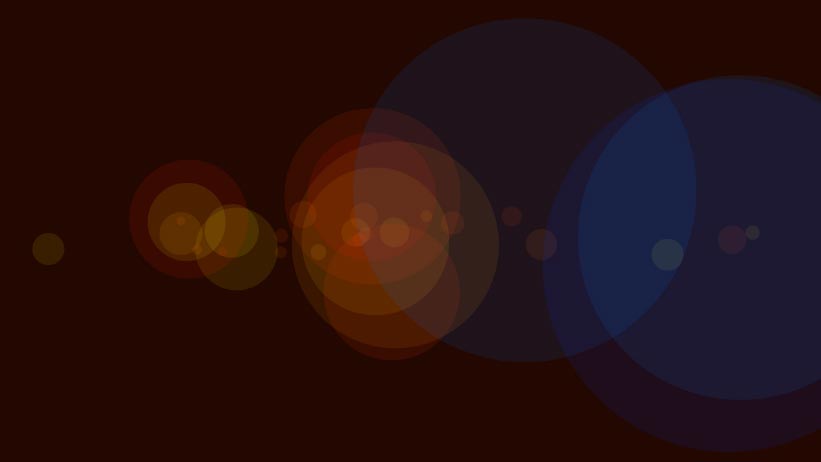
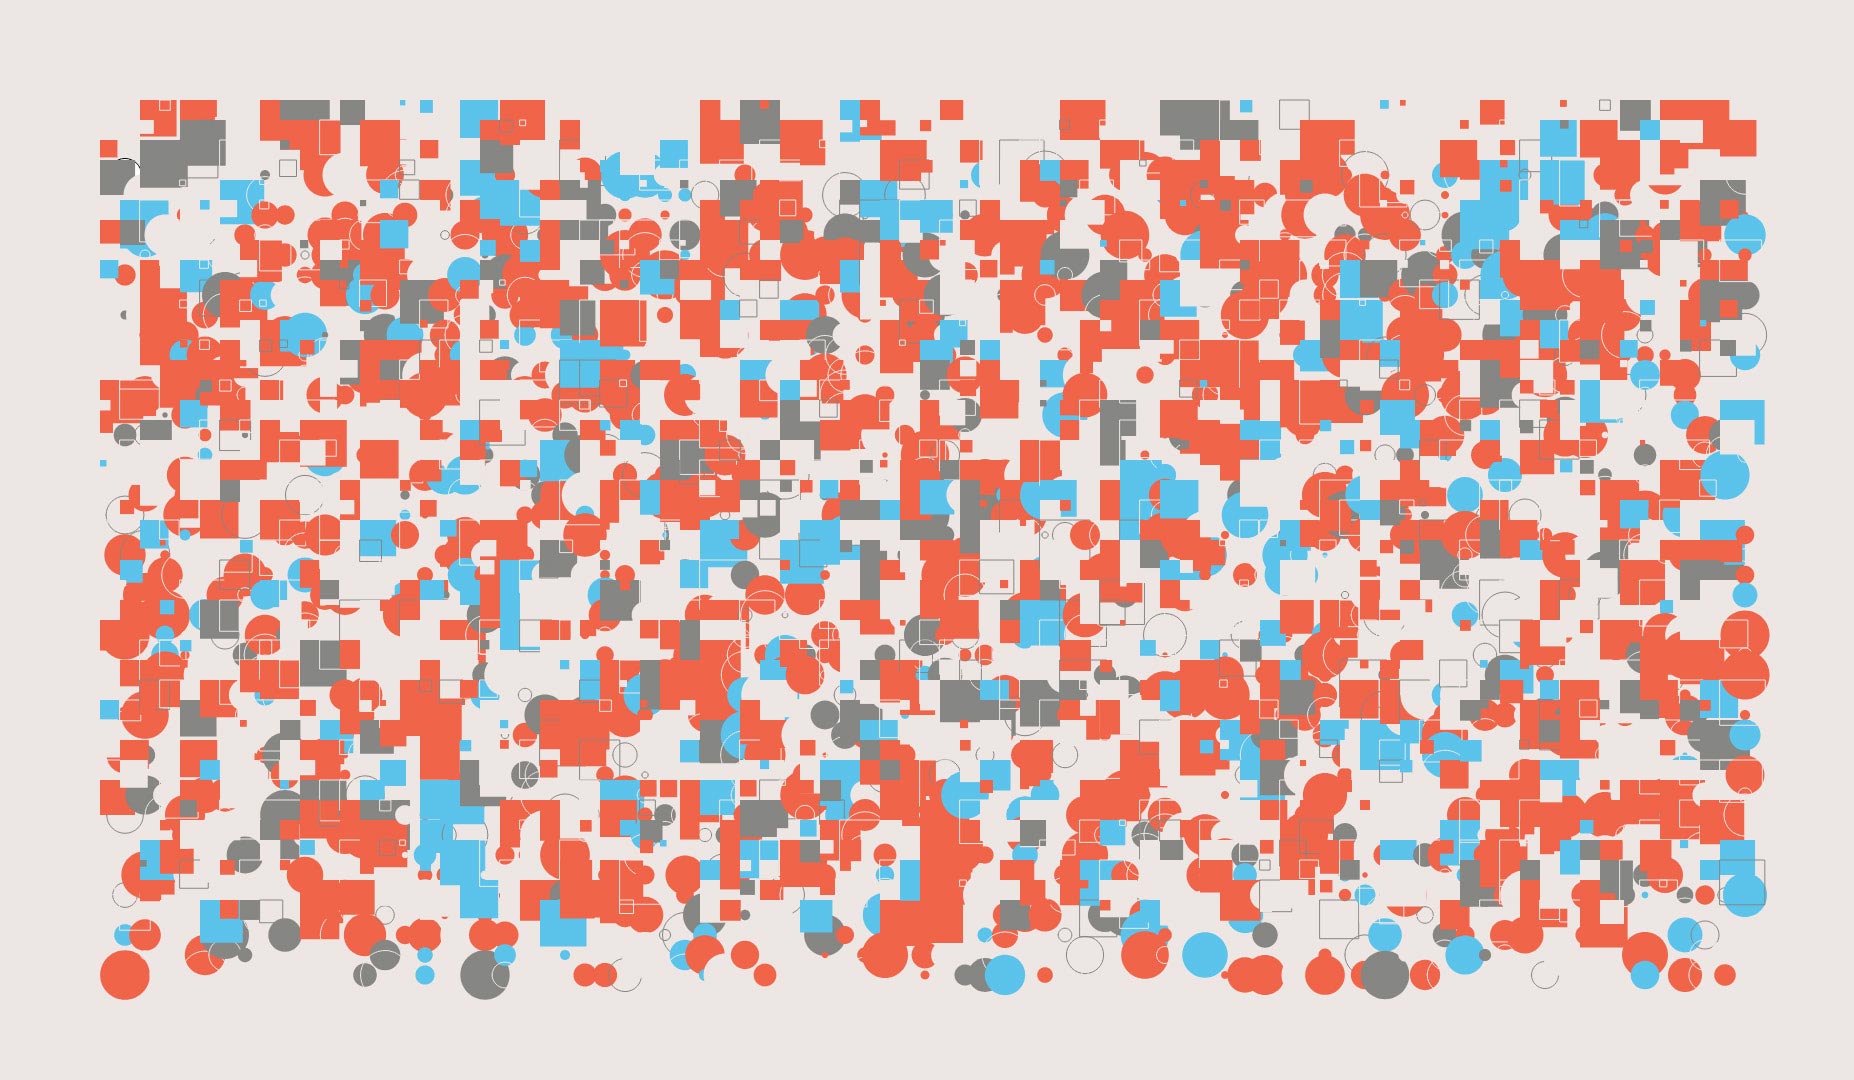
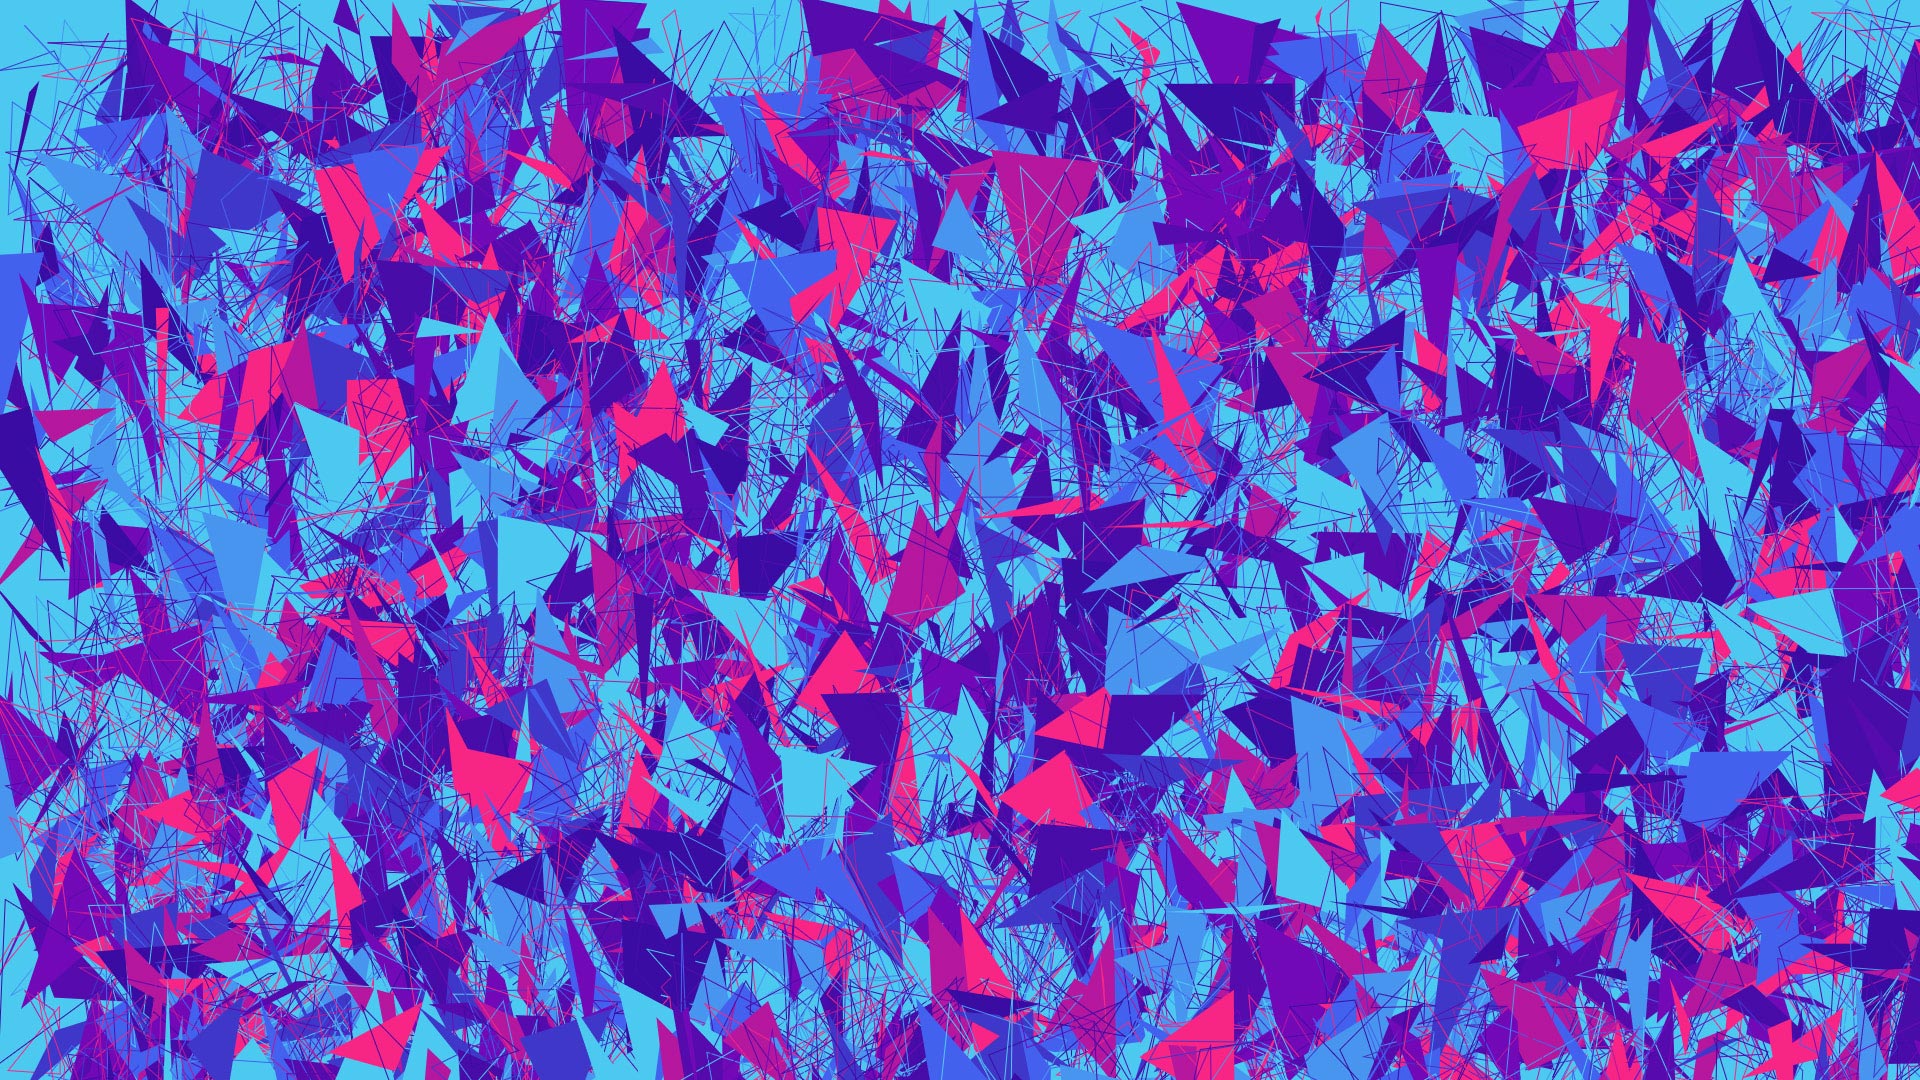
One of the fascinating tenets of generative art is that the same code will generate a completely unique visual output every time.
While this code provides certain constraints in terms of number of circles generated, size of the circles, and ranges of color they take on, because those data points are variable, the combinations are nearly limitless, producing unique outcomes each time the code is run.